Figure 2.
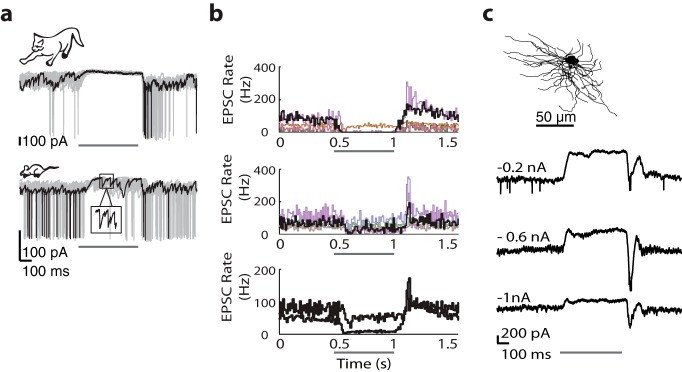
EPSC rates during the pull are higher in mouse than in cat. a, Sample responses to discs of the nonpreferred contrast for relay cells in cat (top) and mouse (bottom); one sample trace is black and remaining traces are gray. Inset, EPSCs at expanded gain and timescale. a–c, Thin dark bar represents stimulus duration. b, Histograms of EPSC rate before during and after the suppressive stimulus for 5 different relay cells in cat (top) and mouse (middle); results from the cells at left are shown in black and from the each remaining cell in a different color (bottom). Averaged histograms for all cells within each species are shown at 2× gain (event rates for mouse are always higher than those for cat). c, Anatomical reconstruction of an On-center relay cell in mouse (top) whose responses (bottom) to discs of the nonpreferred contrast recorded at progressively hyperpolarized levels are shown as averages of many stimulus trials.

