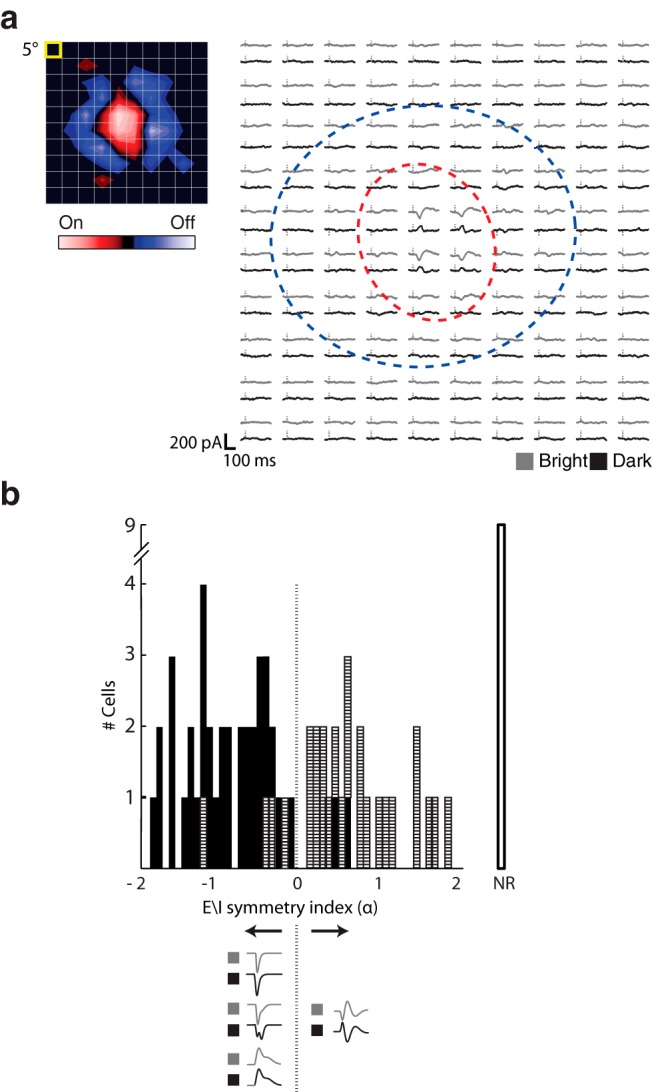
Figure 4.

Pattern of excitation and inhibition in cells with push-pull and other types of responses. a, Receptive field of an On-center relay cell mapped using sparse noise shown as a contour plot (left; yellow box represents stimulus size) and as an array of trace pairs (right) in which the averaged responses to bright (gray traces) and dark (black traces) to each stimulus are placed at corresponding positions in the stimulus grid. Vertical dashes indicate stimulus onset. Red dashed contour indicates the On subregion. Blue dashed contour represents the Off subregion. b, Histogram of the distribution of E\I symmetry indices for relay cells mapped with sparse noise along with a graphical key at bottom. Hatched bins represent cells with push-pull responses. Filled bins represent those with other intracellular profiles. The unfilled bin labeled NR includes cells for which sparse noise did not drive responses.
