Figure 8.
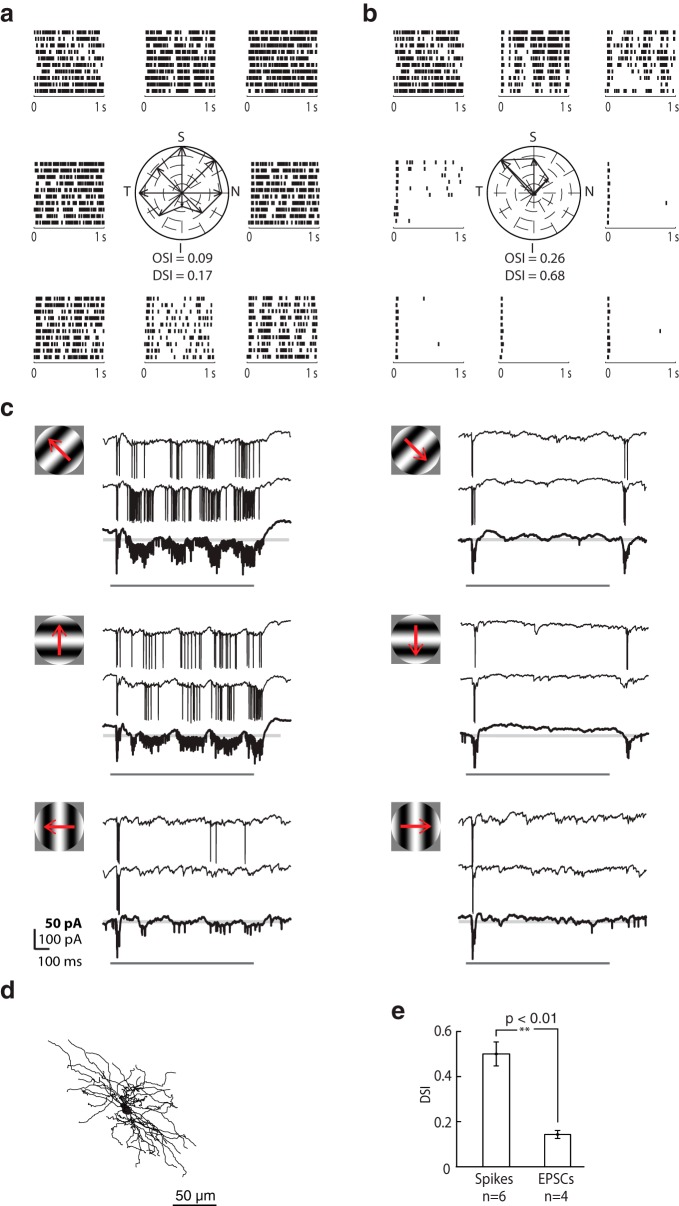
Visually evoked membrane currents recorded from a direction-selective On-Off relay cell. a, Raster plots of EPSCs evoked by full-field sinusoidal gratings of different orientations/directions of motion drifting at 4 Hz surround a polar plot of EPSC rate for each stimulus condition; axes of the polar plots are labeled S (superior), I (inferior), T (temporal), and N (nasal). Each raster plot illustrates 10 repeats of the stimulus and is placed near the corresponding axis of the polar plot. b, Equivalent plots for spikes. c, Sample intracellular responses to gratings drifting in the preferred and suboptimal directions, as depicted by the stimulus icons. Responses to two individual trials of the stimulus are shown above the averaged responses to repeated presentations, bolded and displayed at 2× gain. Pale gray lines indicate baseline. Dark gray bars represent stimulus duration. d, Anatomical reconstruction of the cell. e, Bar graph comparing the tuning of spikes and EPSCs. Error bars indicate SD. Significance was assessed with a two-sample t test.

