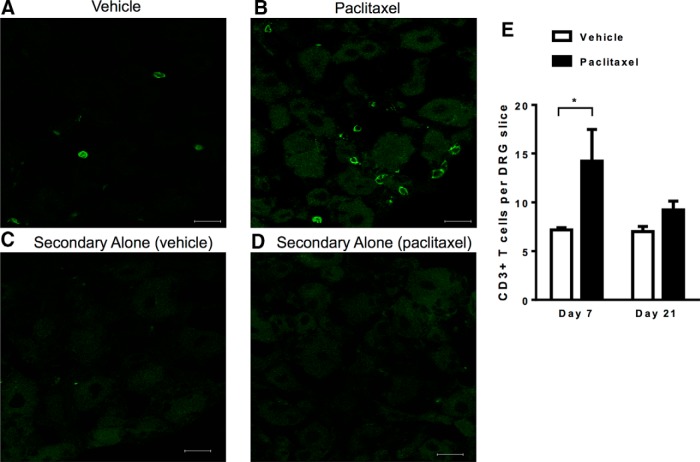
Figure 2.
T-cell localization after paclitaxel treatment. WT mice were treated with paclitaxel or vehicle as in Figure 1A and DRG were collected on day 7. A–D, Representative examples of immunofluorescence analysis of DRG stained with CD3 antibody. Shown are: vehicle treated (A), paclitaxel treated (B), vehicle stained with secondary antibody alone (C), and paclitaxel stained with secondary antibody alone (D). E, Quantification of T-cell numbers/DRG slice. Five slices per mouse were quantified; n = 3–4 mice/group. *p < 0.05, two-way ANOVA followed by Bonferroni post test.. Scale bar, 20 μm.

