
Figure 3.
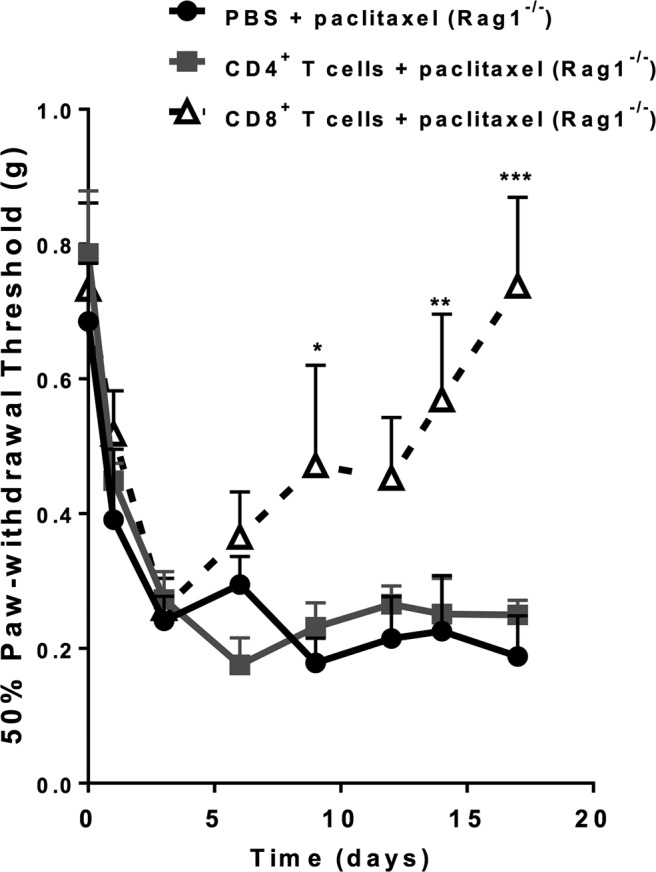
Identification of the T-cell subset responsible for recovery from paclitaxel-induced mechanical allodynia. Paclitaxel (2 mg/kg, i.p.) was administered to Rag1−/− mice on day 0 and day 2. CD8+ or CD4+ T cells were adoptively transferred to Rag1−/− mice 1 d before the first paclitaxel treatment. Shown are: PBS + paclitaxel (circles, black line); CD4+ T cells + paclitaxel (squares, gray line); and CD8+ T cells (open triangles, dashed black line). Mechanical allodynia was measured as in Figure 1. Two-way repeated-measures ANOVA showed a main effect of time (p < 0.0001), group (p < 0.03), and a group-by-time interaction (p < 0.001). Bonferroni post hoc analysis for CD8+ T cells versus saline: *p < 0.05, **p < 0.01, ***p < 0.001; n = 4–6/group. No significant differences were observed between mice receiving CD4+ T cells or saline.