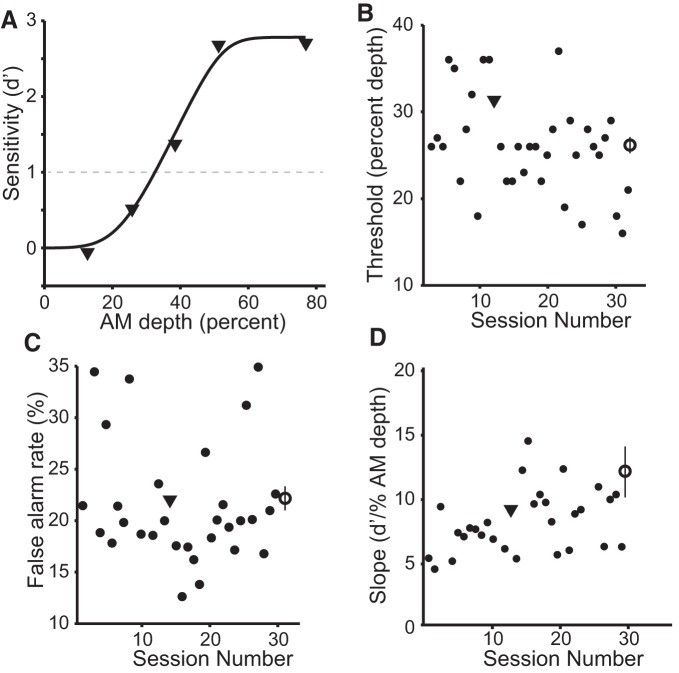
Figure 1.
Behavioral performance on an AM detection task. A, Exemplar fit psychometric function obtained for one gerbil during one session. Black dashed line indicates detection threshold (d′ = 1). B–D, Individual (small black circles) and average (large open circles) psychometric thresholds, psychometric function slopes, and false alarm (FA) rates are plotted. Values measured from exemplar function are indicated by black triangles. Error bars represent SEM.

