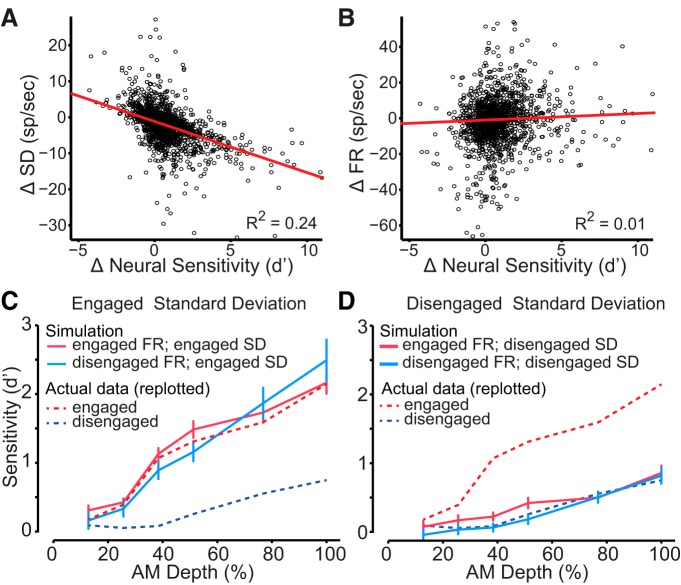
Figure 5.
A, To demonstrate how improvements in neural sensitivity are associated with a decrease in variability, we plotted changes in standard deviation (SD) for individual units (black circles) against changes in firing rate-based neural d′. B, Changes in firing rate (FR) were plotted against firing rate-based d′. Red lines represent linear fits of the data. C, To determine the impact of response variability, neural sensitivity was simulated from the FRs obtained during disengagement from the task with the SD of responses observed during the engaged condition (solid blue line). Original data from Figure 3A are replotted (dashed lines). The simulation indicated that engaged response variability is sufficient to improve neural sensitivity. As expected, a simulation using both engaged FR and variability (solid red line) also performs well. D, In a second assessment of response variability, neural sensitivity was simulated from the FRs obtained during the engaged condition with the response SD obtained during the disengaged condition (solid red line). This simulation indicated that disengaged response variability is sufficient to degrade neural sensitivity. As expected, a simulation using both disengaged FR and variability (solid blue line) also performed poorly. Error bars represent SEM.

