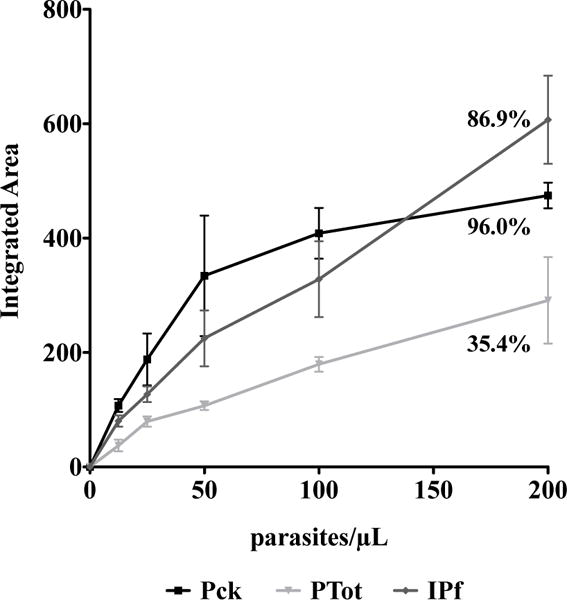
Fig. 5.

Comparison of the titration curves for three of the RDT brands used for the study on the effect of individual donor samples, which show differences in brand performance. The WHO panel detection score for each brand tested is indicated on the graph.
