
Fig. 2.
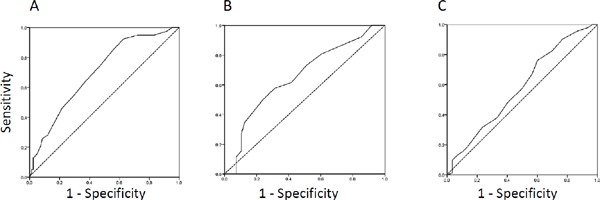
ROC curve analysis of AF for predicting subclinical atherosclerosis.
A. CACS > 100, area under the curve (AUC) = 0.698 (95% CI, 0.602–0795, p < 0.001). B. PWV > 1800 cm/s, AUC = 0.655 (95% CI, 0.538–0773, p < 0.05). C. max IMT > 1.1 mm, AUC = 0.582 (95% CI, 0.460–0704, n.s.).