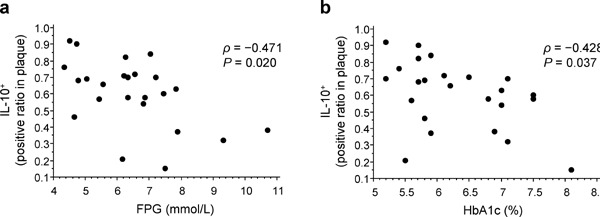
Fig. 2.

Correlation between glucose metabolism and the IL-10+ ratio in carotid plaques
Scatter plots highlighting the correlation between the IL-10+ ratio in carotid plaques and both FPG (a) and HbA1c (b) levels. ρ, Spearman's rank correlation coefficient
