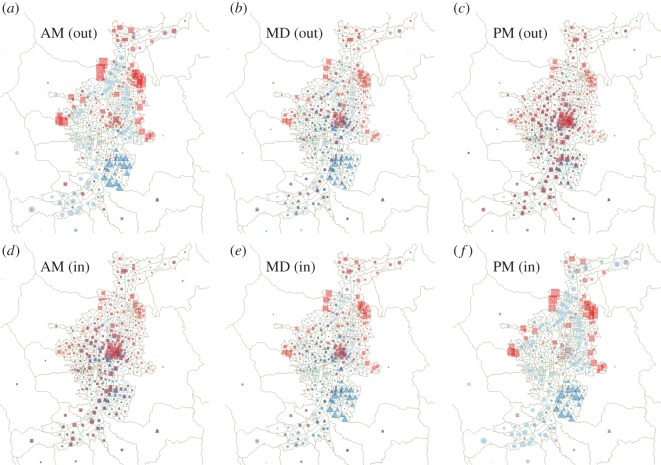
Figure 3.
Geographical location of origin (out, (a–c)) and destination (in, (d–f)) nodes of the trips performed during each time slot (AM left, MD middle, PM right) by the individuals of three socio-economic classes, namely 1 (poorest, red squares), 3 (low middle class, light blue circles) and 6 (richest, dark blue triangles). The size of symbols indicate the in- (out-)strength of nodes for the time slot considered.

