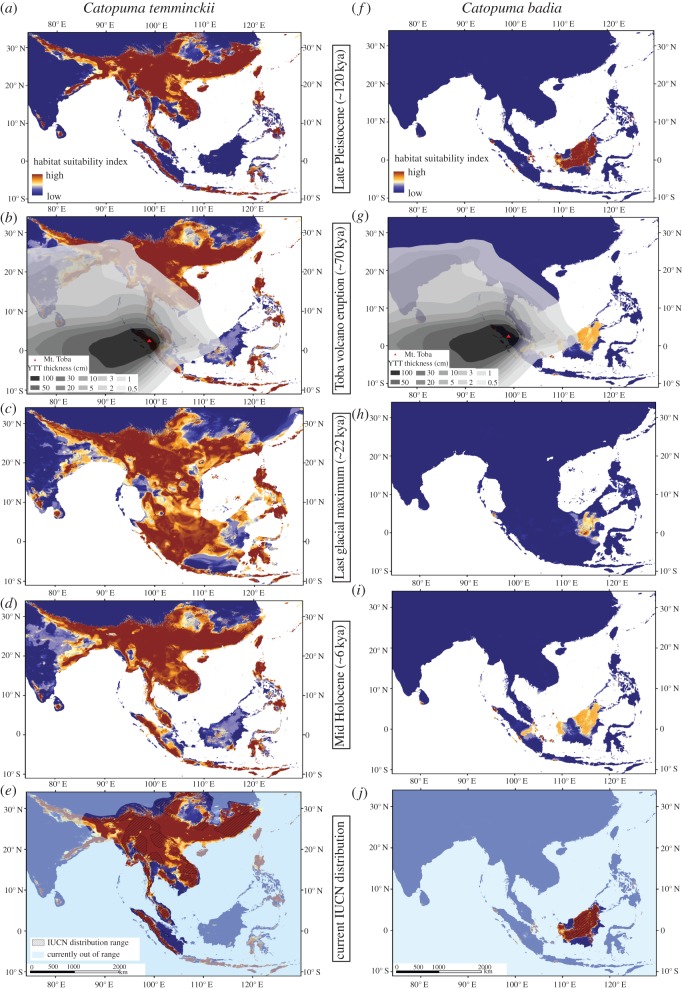
Figure 5.
Projected distribution of the Asian golden cat (a–e) and the bay cat (f–j) along a time axis from 120 kya until present: (a,f) for the Late Pleistocene (approx. 120 kya) using the LGM projections; (b,g) the thickness of the Young Toba Tuffs (YTT) was superimposed on the projection to indicate the severity of impact of the Toba super volcanic eruption approximately 74 kya; (c,h) the Last Glacial Maximum (approx. 22 kya); (d,i) the mid Holocene (approx. 6 kya) and (e,j) the current distribution according to the IUCN Red List of Threatened Species used for the modelling (hatched pattern), while areas outside of the current distribution were shaded in light blue.

