
Figure 2.
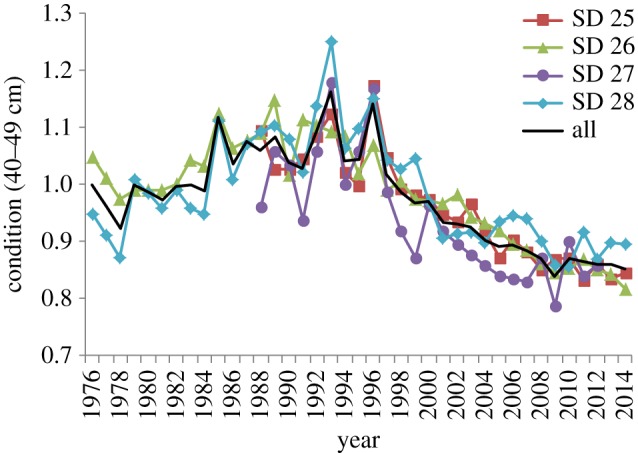
Temporal developments of mean cod condition in the different subdivisions (SDs) of the Central Baltic Sea for cod 40–49 cm. The black thick line is the average between the SDs.
Official websites use .gov
A
.gov website belongs to an official
government organization in the United States.
Secure .gov websites use HTTPS
A lock (
) or https:// means you've safely
connected to the .gov website. Share sensitive
information only on official, secure websites.
Temporal developments of mean cod condition in the different subdivisions (SDs) of the Central Baltic Sea for cod 40–49 cm. The black thick line is the average between the SDs.