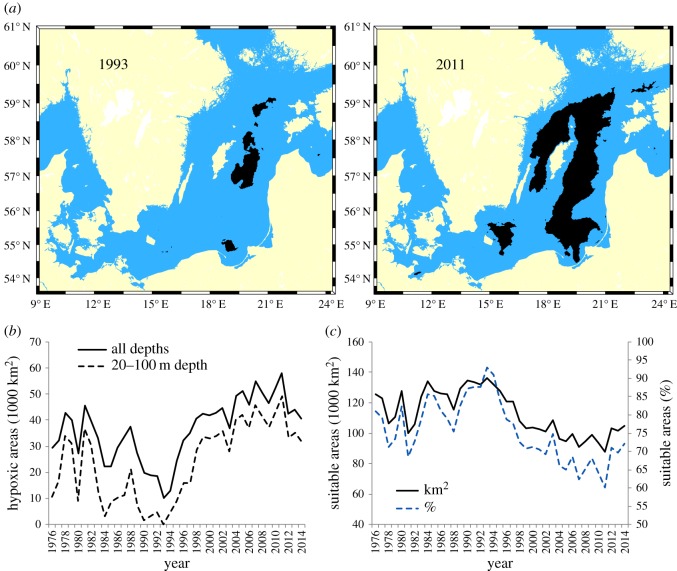
Figure 6.
(a) Maps of hypoxic areas (less than or equal to 1 ml l−1 oxygen concentration) in 1993 and 2011; (b) time-series of total hypoxic areas (all depths), and hypoxic areas between 20 and 100 m depth, the latter used as predictors to explain cod condition in the GAMs; (c) time-series of suitable areas for cod (more than 1 ml l−1 oxygen concentration) between 20 and 100 m depth, in absolute values and in percentage. The time-series refer to the Central Baltic Sea (SDs 25–28).

