
Figure 2.
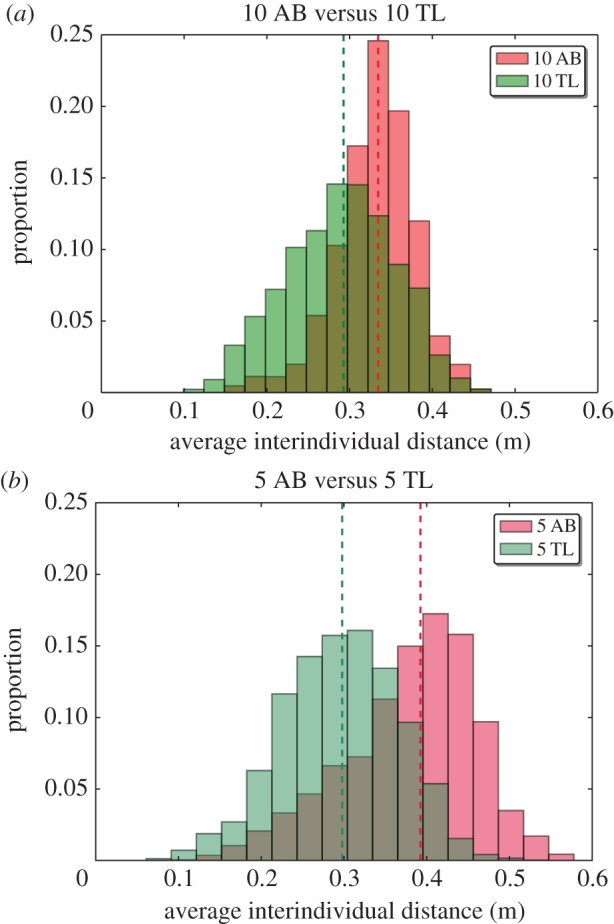
Average interindividual distance in the square arena with two cylinders (a) for 10 AB zebrafish (N=518 960 measurements) versus 10 TL zebrafish (N=500 794 measurements). The red distribution represents 10 trials with groups of 10 AB zebrafish and the green represents 10 trials with groups of 10 TL zebrafish. (b) For 5 AB zebrafish (N=528 357 measurements) versus 5 TL zebrafish (N=495 659 measurements). The red distribution represents 10 trials with groups of 5 AB zebrafish and the green is for 10 trials with groups of 5 TL zebrafish. Dashed lines represent medians. TL zebrafish are more cohesive than AB zebrafish. Smaller groups of AB zebrafish show a shift to higher values. The distributions of the average interindividual distances of 10 AB and 10 TL are different, 5 AB and 5 TL are different, 5 AB and 10 AB are different and 5 TL and 10 TL are different.