
Figure 9.
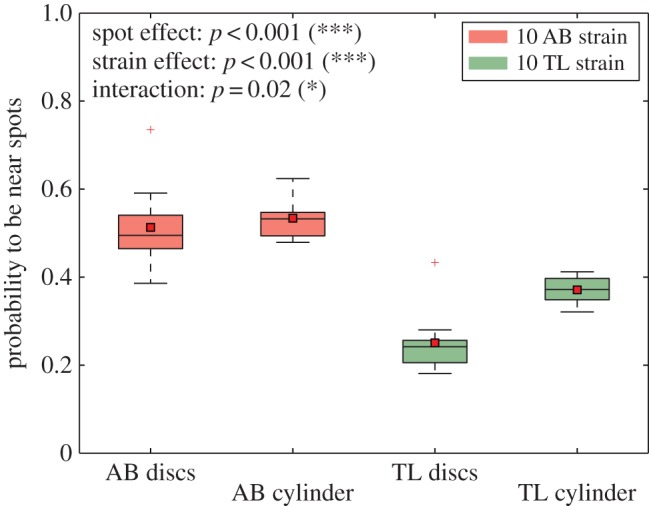
Probability to be at 25 cm from the centre of cylinders or discs for 10 trials. Groups of 10 AB or 10 TL zebrafish in a tank with two cylinders or two discs. The black line shows the median, the red square shows the mean. A series of tests shows that groups of 10 AB are attracted by cylinders as much as discs, groups of 10 TL are more attracted by cylinders than discs, groups of 10 AB are more attracted by the cylinders and the discs than groups of 10 TL. N=10 measurements for AB disc, AB cylinder, TL disc and TL cylinder. Each boxplot is composed of 10 values of probability *p<0.05, **p<0.01, ***p<0.001, n.s., non-significant.