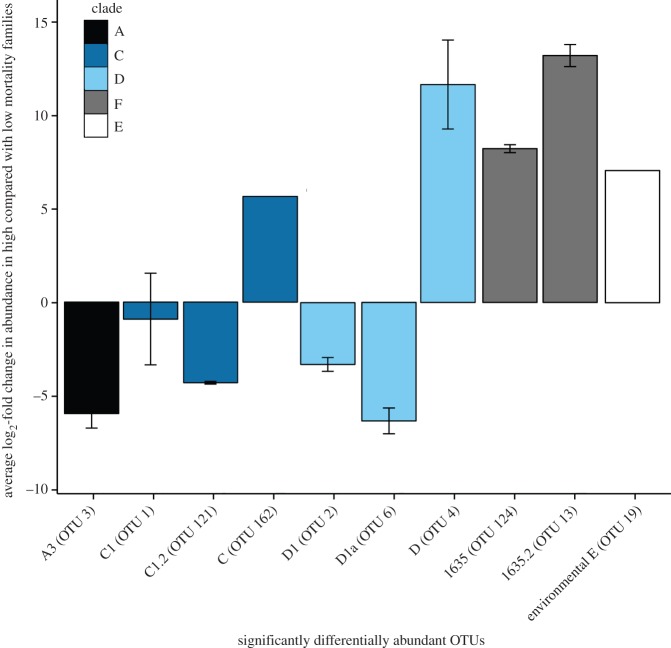
Figure 5.
Average log2-fold changes in abundance in high (more than 90%) mortality families in comparison to low (less than 10%) mortality families. Log2-fold changes were calculated from negative binomial generalized linear models in DESeq2, with standard error bars representing significant Benjamini–Hochberg p-values (p < 0.05). Colours represent the classification of different Symbiodinium types in clades: A, C, D, F and environmental Symbiodinium (clade E).

