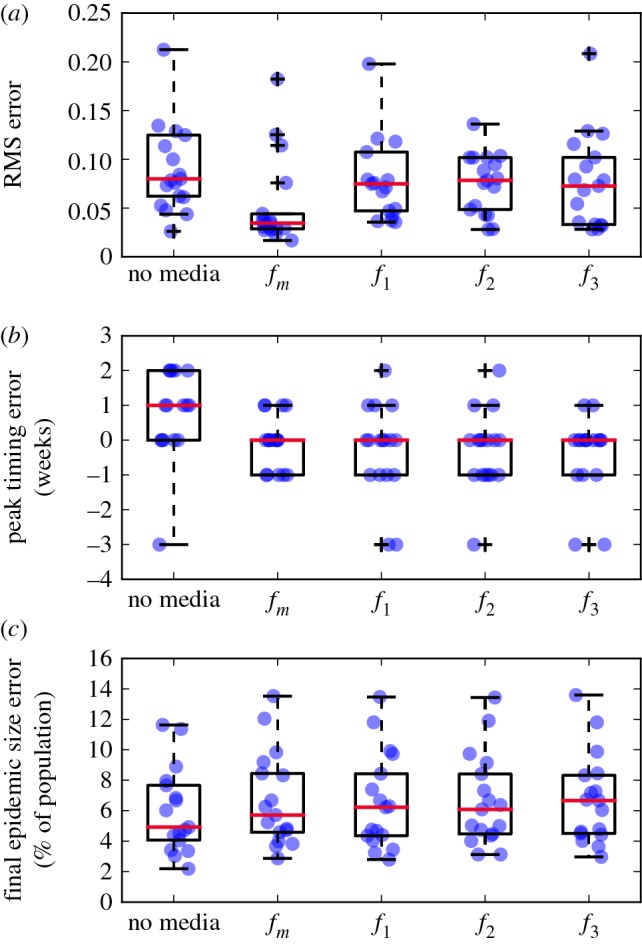
Figure 4.

Boxplots of RMS error (a), peak timing error (b) and final epidemic size error (c), for standard model and models with media effects for 1998/1999–2014/2015 seasons. The 2009/2010 pandemic influenza season has been excluded. Blue dots show results from individual years (where we have added random jitter for visibility), crosses show outliers.
