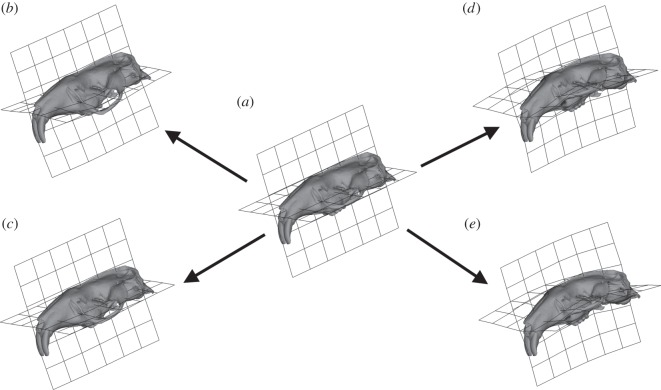
Figure 5.
Transformation grids and surface warps associated with PCA plot (figure 4) representing the differences of deformation between the two models scaled to force : area ratio. Arrows represent the change in size and shape between unloaded mean model and target. (a) Unloaded mean model, (b) size and shape change from unloaded model to Fukomys model in occlusion, (c) size and shape change from unloaded model to Bathyergus model in occlusion, (d) size and shape change from unloaded model to Fukomys model at 90° gape and (e) size and shape change from unloaded model to Bathyergus model at 90° gape.

