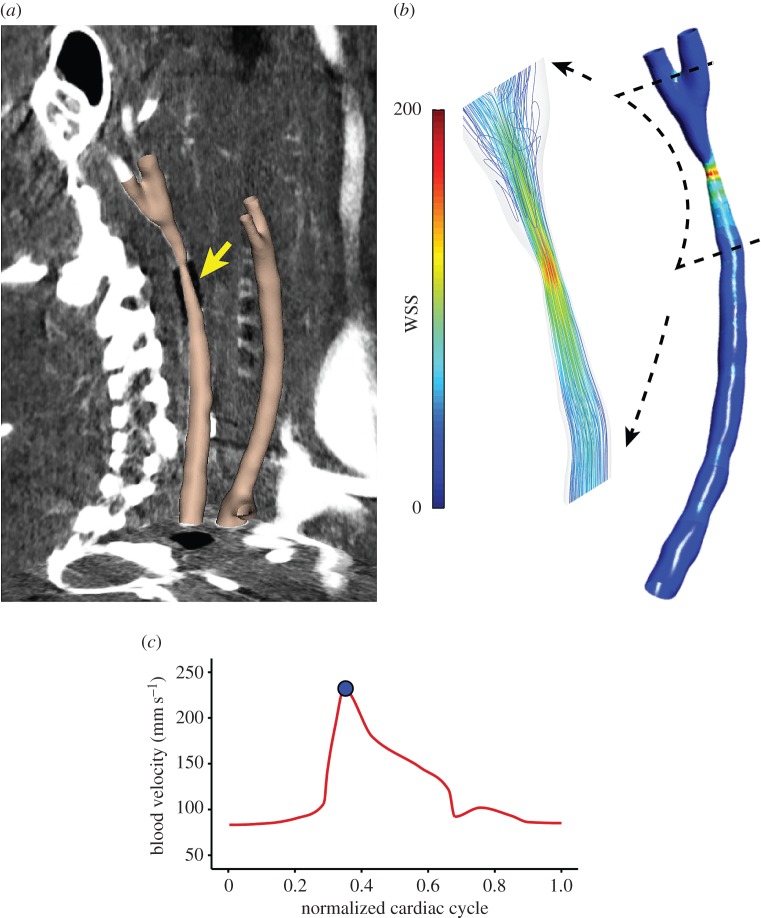
Figure 2.
(a) Final three-dimensional reconstruction of both carotid arteries, instrumented and control, from a representative mouse, that were digitally flesh-coloured and superimposed onto the three orthogonal planes of the raw micro-CT image dataset. The position of the cuff is indicated by the yellow arrow. (b) Distribution of WSS magnitude (Pa) within the instrumented vessel from CFD. The magnified inset shows streamlines around the region of the cuff (note the presence of multidirectional flow in the downstream segment). (c) Line plot shows the pulsatile blood velocity (mm s−1) measured over the cardiac cycle of the instrumented vessel, which was imposed at the inlet of the model in the CFD simulation used to compute WSS (blue dot indicates the position in the cardiac cycle as peak systole for the given WSS map).

