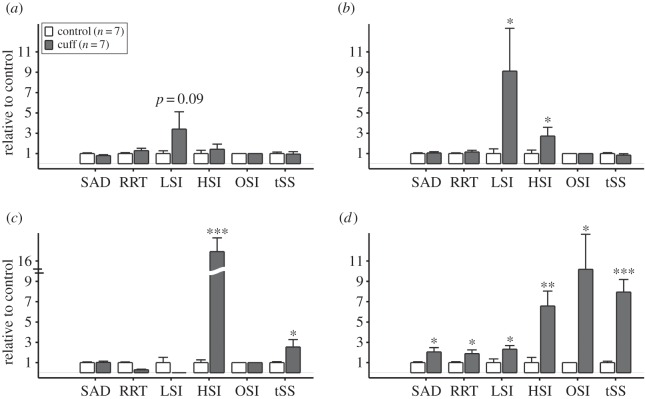
Figure 5.
The mean magnitude of each WSS metric averaged over all instrumented (n = 7; dark grey bars) and contralateral control (n = 7; white bars) vessels segregated into (a) upstream outside of the plaque, (b) upstream within the plaque, (c) cuff and (d) downstream regions (each control vessel was segregated into the same number of vessel segments of comparable length as the contralateral instrumented vessel for purposes of comparison). The values of each WSS metric for both the instrumented and control vessels are scaled by the mean of the WSS metric over the control vessels (thus, all controls have a mean scaled value of 1). Comparisons were made only between instrumented and control for each WSS metric. Statistically significant differences are indicated by *p < 0.05, **p < 0.01, and ***p < 0.001. Bars are mean ± s.e.

