Fig. 2.

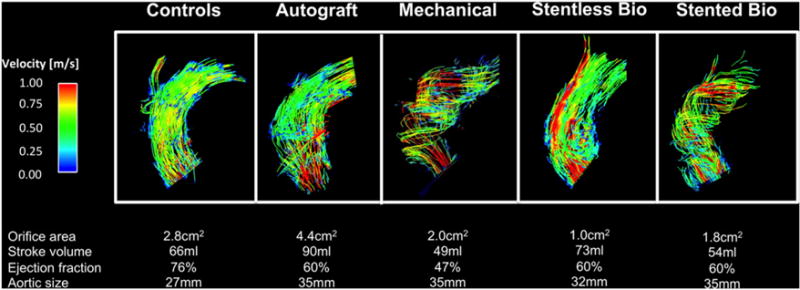
Visualization of the blood flow in the ascending aorta using particle traces during peak systole for each type of AVR. Relevant anatomic and functional data are given for the individuals below.

Visualization of the blood flow in the ascending aorta using particle traces during peak systole for each type of AVR. Relevant anatomic and functional data are given for the individuals below.