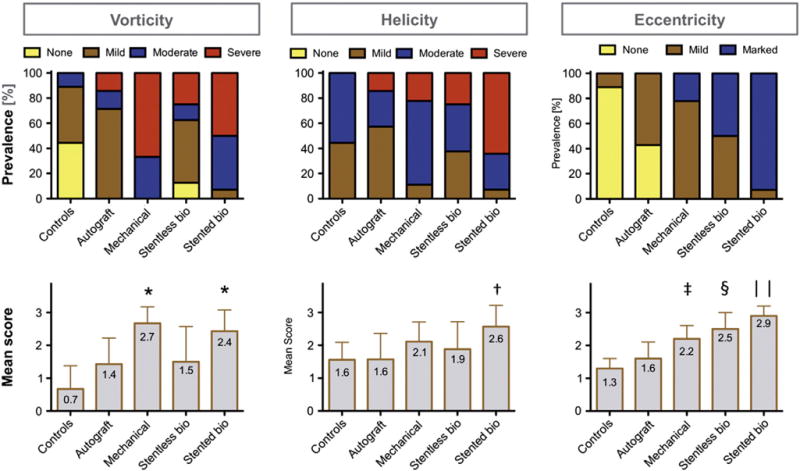
Fig. 4.

Evaluation of vorticity, helicity and eccentricity of blood flow: The upper row shows the frequency of each score for the various AVR groups and controls. The lower row depicts the mean ± SD scoring results (*p < 0.05 vs. stentless, autografts and controls; †p < 0.05 vs. stentless, autografts and controls; ‡p < 0.05 vs. controls; $p < 0.05 vs. stented, autografts, controls; ║p < 0.05 vs. stentless, mechanical, autografts and controls).
