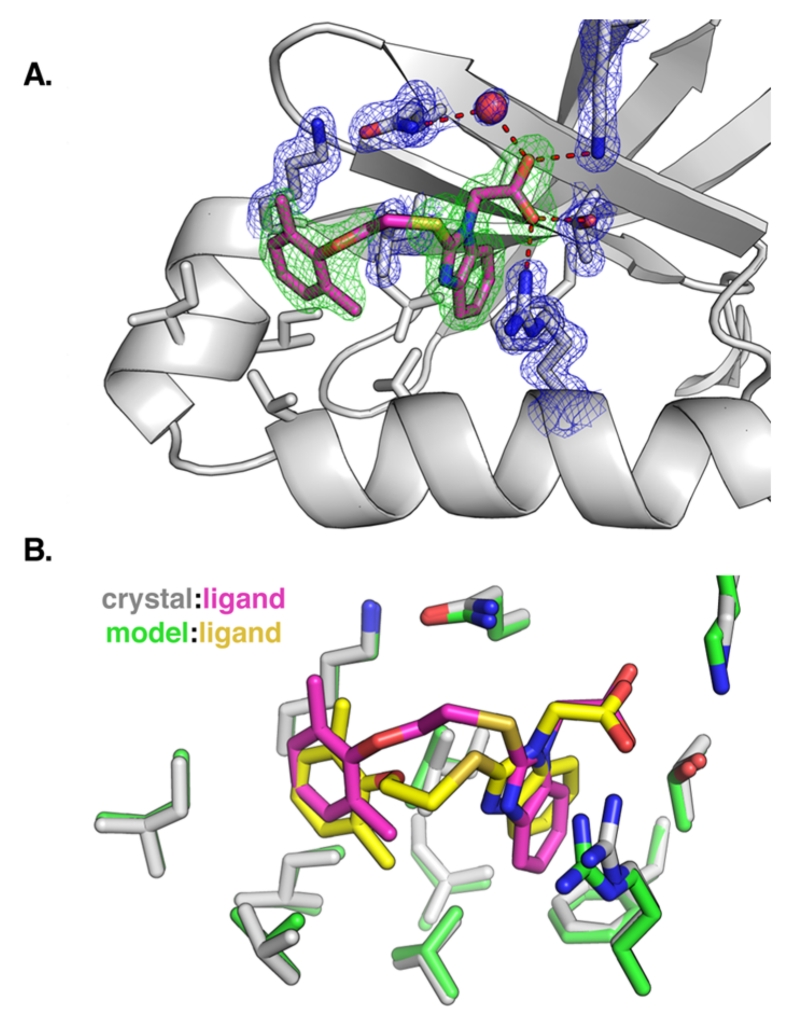
Figure 4.
(A) Crystal structure of PDK1 bound to compound 4. Electron density is shown for the ligand (green, Fo – Fc omit map, 3σ) and for key interacting residues (blue, 2Fo – Fc map, 1.25σ). (B) Overlap of the crystallographic binding pose and the docking pose for compound 4, following least-squares superposition of the PDK1 atoms.

