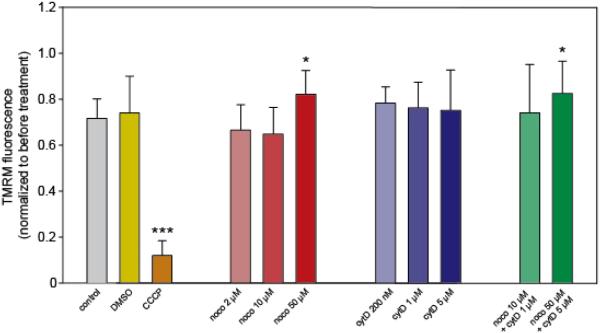
Figure 2. Mitochondrial potential remains unchanged following treatment with cytoskeletal toxins.
Before drug treatment, cells were imaged in both the mitoGFP and TMRM channels. The mitoGFP channel was used to create a mitochondrial ROI which was then overlaid onto the TMRM image in order to measure fluorescence only within the mitochondria. The same procedure was repeated at 30 minutes following drug treatment, and resulting TMRM fluorescence for each was normalized to fluorescence for that cell prior to treatment. N=7-22 cells per group, each from a separate dish. * indicates an adjusted p-value of < 0.05, *** indicates adjusted p < 0.001 resulting from pairwise t-tests.

