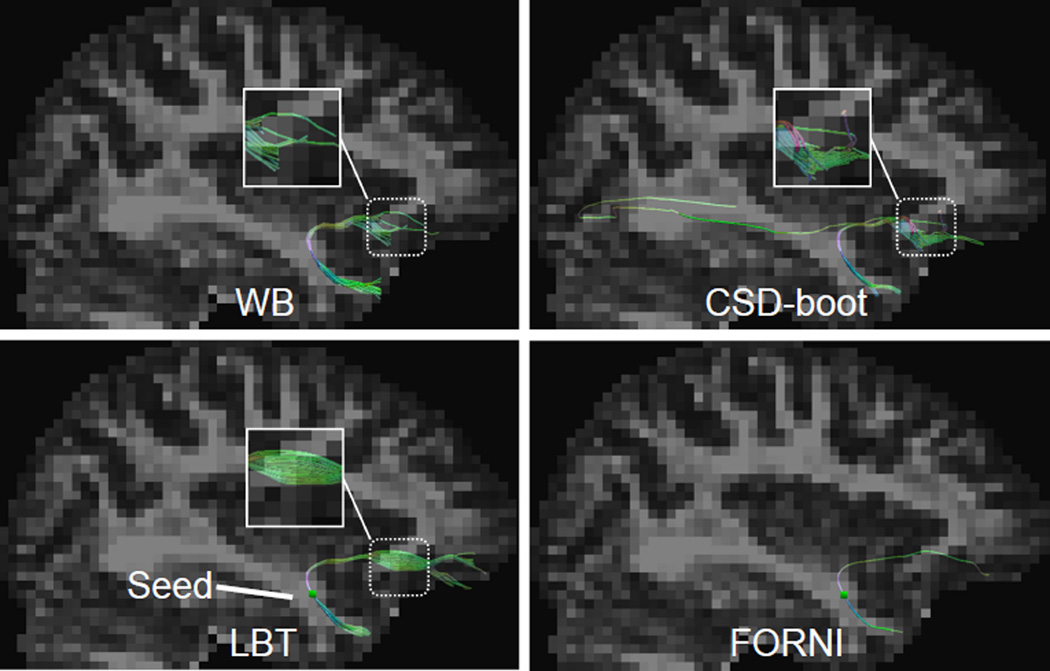
Figure 6.
Tractography results seeded in the UNC in the sagittal view. A deterministic fiber tracking result using FORNI FOs is also shown for a tract shape reference. The seeding voxel is represented by the green square within the LBT and FORNI results in the second row. Note the highlighted zoomed region for comparison.

