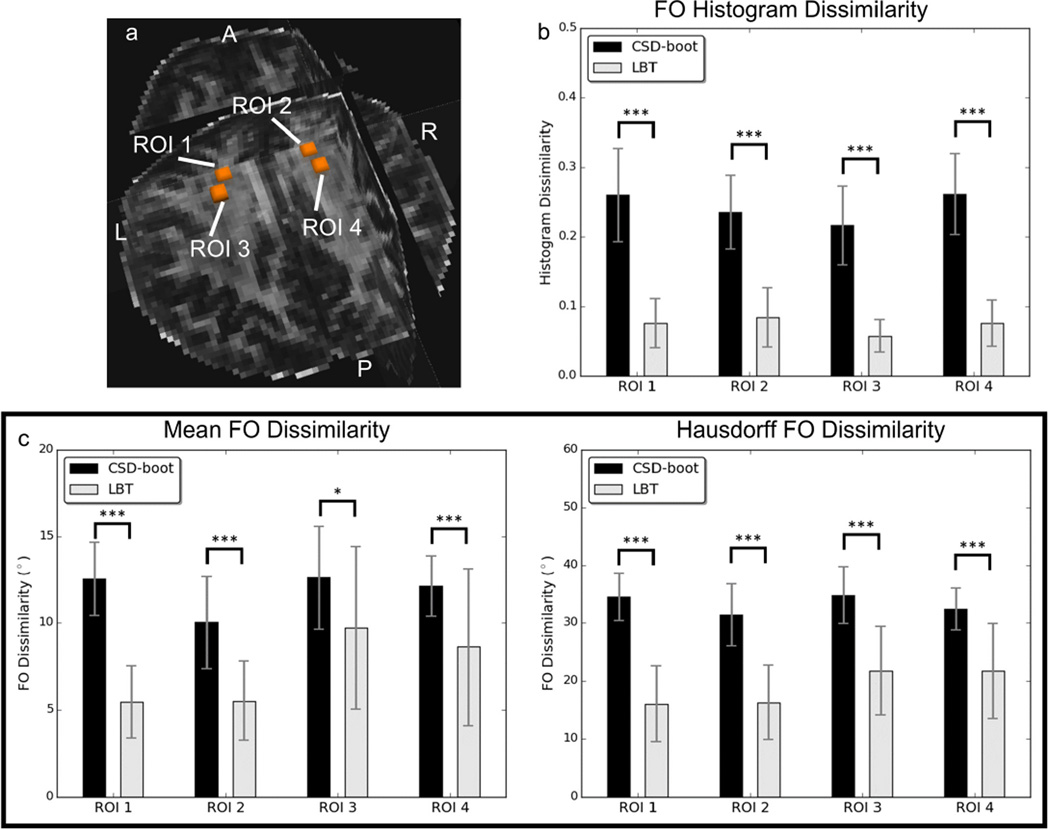
Figure 9.
FO reproducibility for Subject 1: (a) ROIs replaced in the crossing regions of the CC and CST for FO dissimilarity evaluation, (b) means and standard deviations of the histogram dissimilarity of FOs in each ROI, and (c) means and standard deviations of the FO dissimilarity in each ROI. Asterisks indicate that the difference between the CSD-boot and LBT results is significant using a paired Student’s t-test (*p < 0.05, ***p < 0.001).

