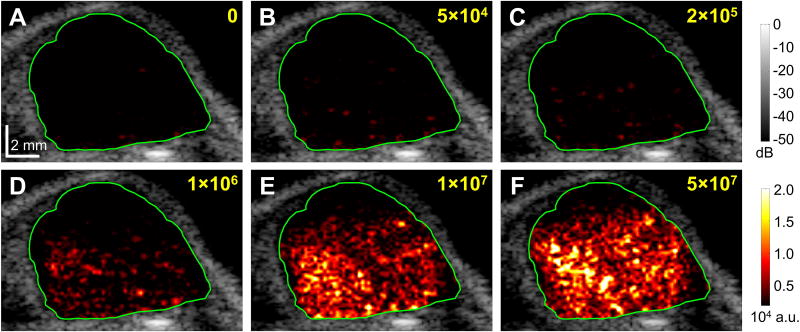
Figure 3. Representative images of the same tumor under different injection doses of targeted microbubbles.
A, no injection; B, 5 × 10⁴ MBVEGFR2; C, 2 × 10⁵ MBVEGFR2; D, 1 × 10⁶ MBVEGFR2; E, 1 × 10⁷ MBVEGFR2; F, 5 × 10⁷ MBVEGFR2. B-mode images overlaid with color-coded multi-frame compounding PI images (within the ROI) of the tumor for injection of MBVEGFR2. Green lines define the ROI of the tumor. Images were taken approximately 20 s after the injection of microbubbles. Scale bar in A represents 2 mm.

