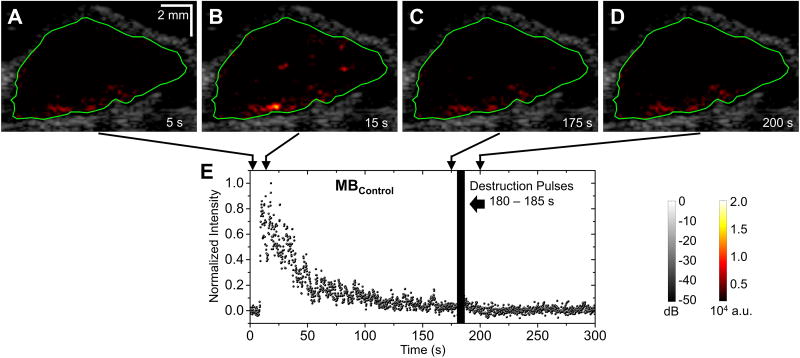
Figure 5. Representative images and normalized signal intensities for control microbubbles (one trial at 2 × 10⁵ microbubbles per mouse).
A – D, B-mode images overlaid with color-coded multi-frame compounding PI images (within the ROI) of the tumor for injection of MBControl. Green lines define the ROI of the tumor. E, Normalized signal intensity profile of the ROI for injection of MBControl. Microbubble injection was performed 5 s after the start of imaging sequence. Destruction pulses were transmitted from 180 to 185 s.

