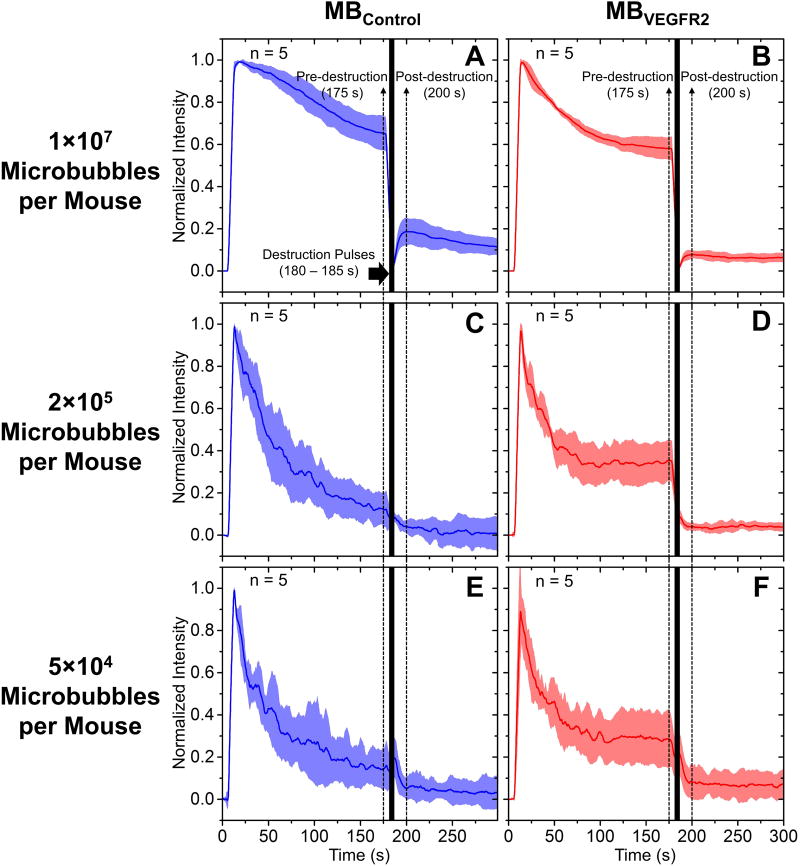
Figure 6. Average signal intensity profiles for the pre-burst minus post-burst method.
A, 1 × 10⁷ MBControl per mouse; B, 1 × 10⁷ MBVEGFR2 per mouse; C, 2 × 10⁵ MBControl per mouse; D, 2 × 10⁵ MBVEGFR2 per mouse; E, 5 × 10⁴ MBControl per mouse; F, 5 × 10⁴ MBVEGFR2 per mouse. Solid lines indicate the mean and shadows indicate the error bars (mean ± standard deviation). Microbubbles were injected at 5 s. Destruction pulses were transmitted from 180 to 185 s. Pre- and post-destruction signal intensities are defined at 175 s and 200 s, respectively.

