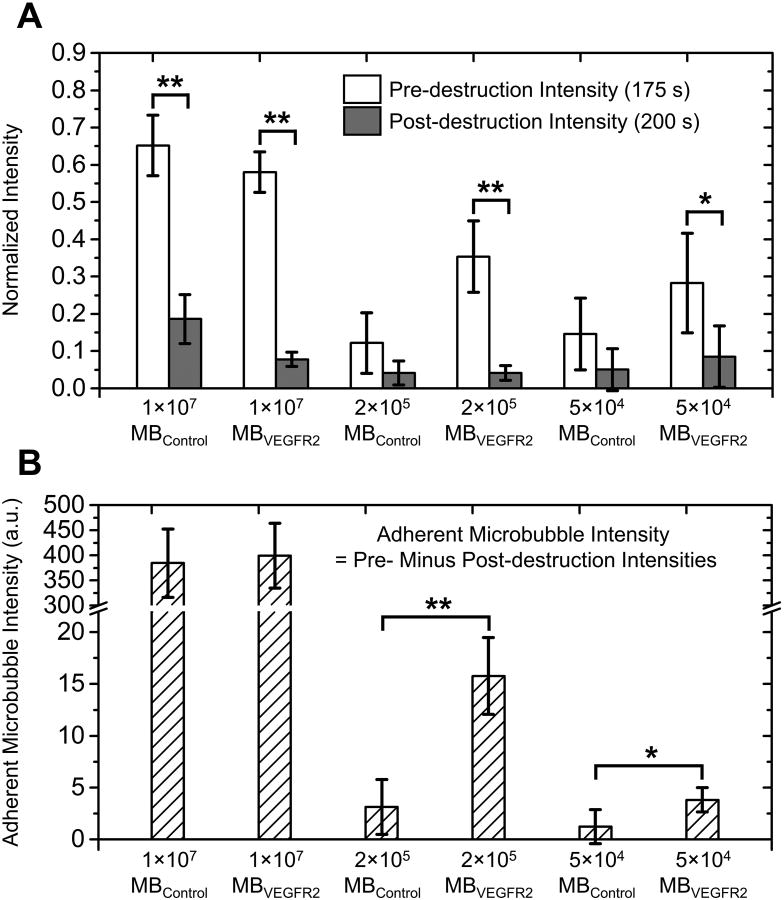
Figure 7. Pre- and post-destruction signal intensities and adherent microbubble signal intensities.
A, Bar plot of normalized pre-destruction (white bar, 175 s) and post-destruction (gray bar, 200 s) signal intensities at different microbubble doses. B, Bar plot of adherent microbubble intensities (defined as pre-destruction minus post-destruction signal intensities) at different microbubble doses. (** p < 0.0001, * p < 0.05)

