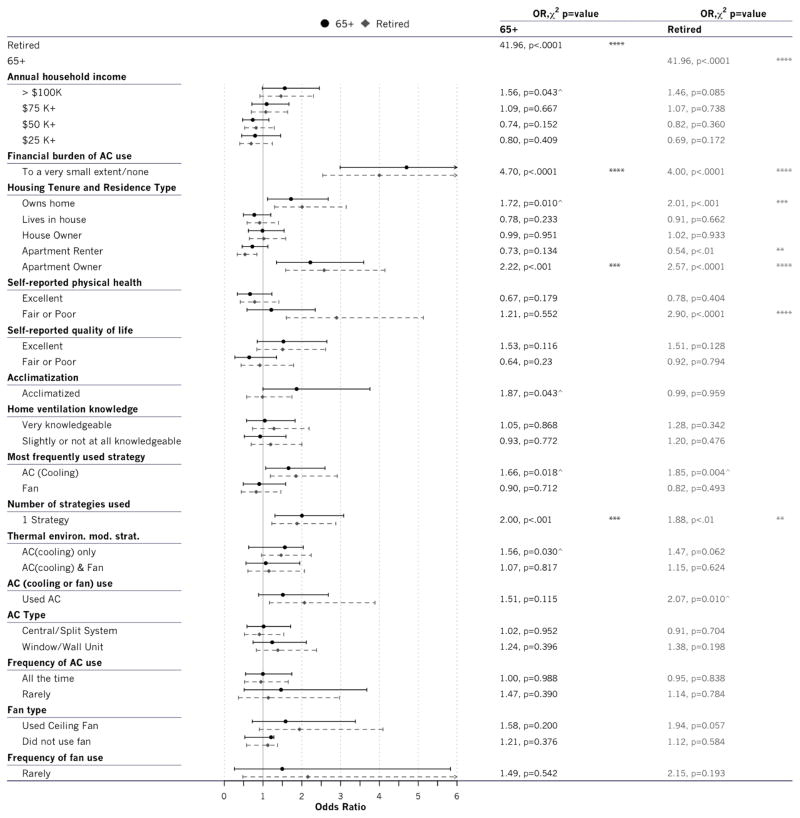
Figure 5.
Comparisons of respondents 65+ and respondents who were retired against respondents <65, and respondents not retired (OR=1); * p<.05, ** p<.01, *** p<.001, **** p<.0001; ^ means the Pearson’s Chi-Square statistic was significant but standard residuals in individual cells were not (i.e. barely significant therefore interpret with caution)

