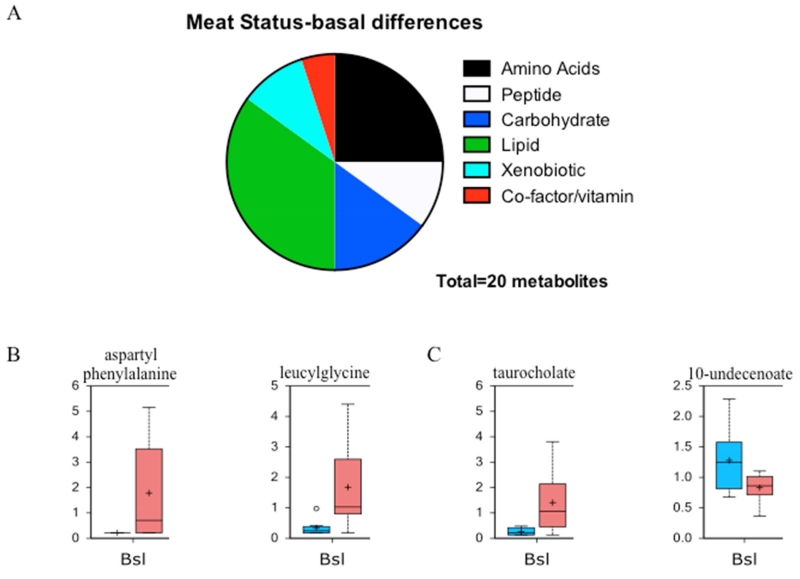
Figure 1. Baseline metabolomic differences between meat allergic and control subjects.
A. Differentially expressed metabolites between control and meat allergic subjects displaying the major metabolic pathways and proportion altered. B. Representative box plots showing basal expression levels of two peptides aspartylphenylalanine and leucylglycine that were significantly different (p<0.05). C. Representative box plots showing the basal expression levels of two lipids taurocholate and 10-undecenoate that were significantly different (p<0.05). The blue box is control and red box meat allergic with the box representing the upper and lower quartiles, the black bar being the median and the whiskers representing the maximum and minimum of distribution.

