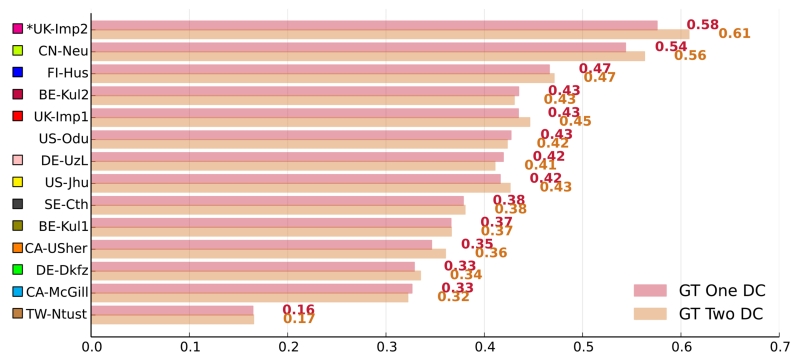
Figure 5.
Differences in performance on the two ground truth sets. The graph shows each methods average DC scores on the 36 testing dataset cases broken down by ground truth set. A star (*) before a team’s name denotes statistical significant difference according to a paired Student’s t-test with p < 0.05. The methods are color coded.

