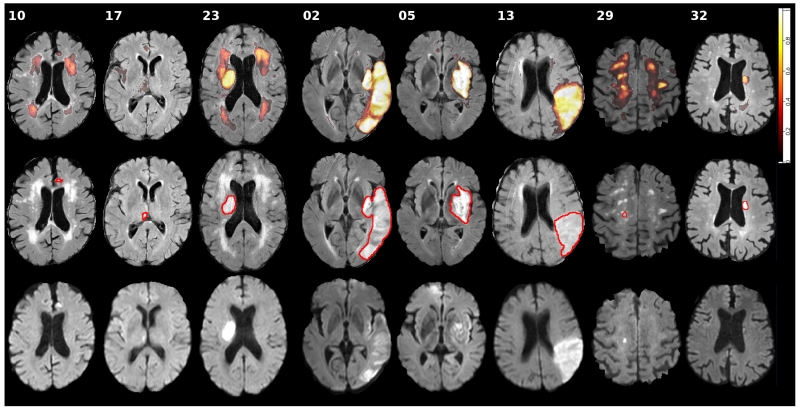
Figure 7.
Visual results for selected difficult (10, 17, 23), easy (2, 5, 13), and second center (29, 32) cases from the SISS testing dataset. The first row shows the distribution of all 14 submitted results on a slice of the FLAIR volume. The second row shows the same image with the ground truth (GT01) outlined in red. And the third row shows the corresponding DWI sequence. Please refer to the online version for colors.

