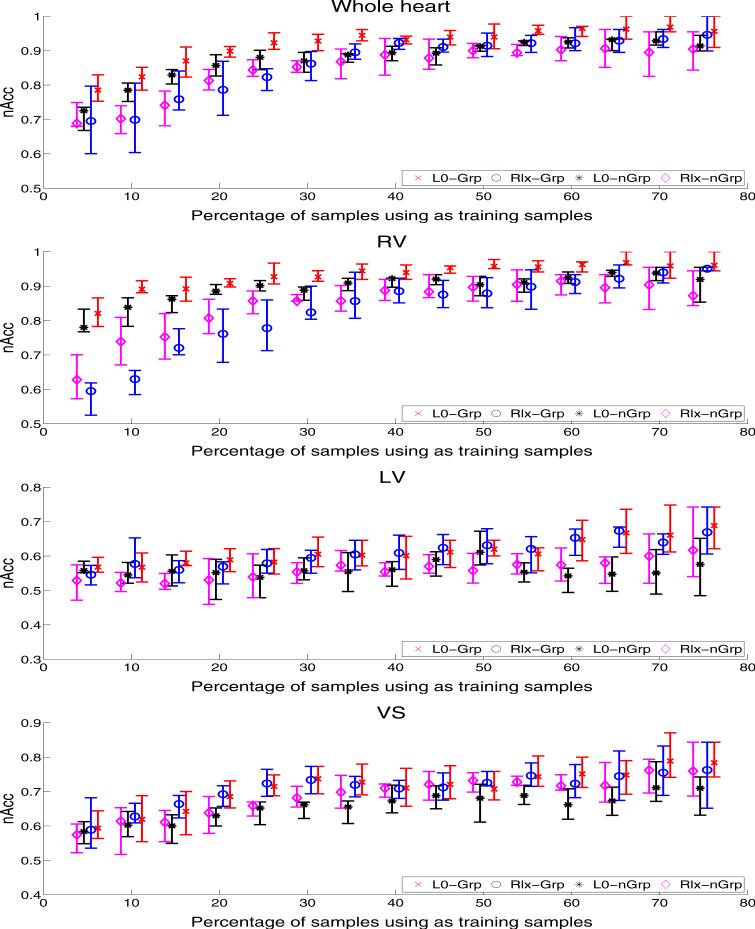
Figure 3.
The boxplots of the average, first quintile, and fourth quintile nAcc scores for all four ensembles with respect to the percentage of the whole data set used for training and the encoding of the LV, RV, VS and the whole heart (RV,LV&VS). For the RV and whole heart, the proposed L0-Grp implementation (red box plots) generally achieves a higher average, first quintile, and fourth quintile scores than then other three approaches. With respect to the LV and VS, all four methods perform similarly with the average nAcc scores starting at around 55% and generally increasing with the number of training samples.

