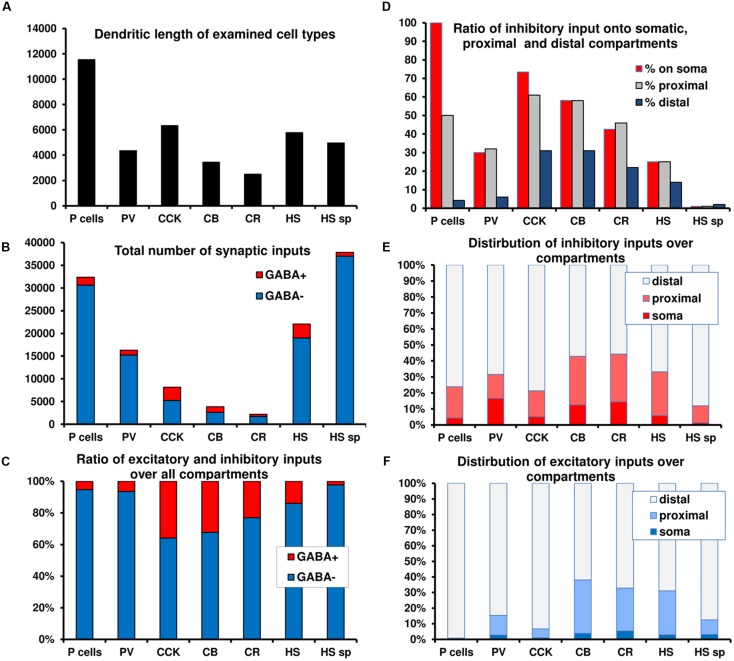
FIGURE 2.
Summary graphs of the distribution of excitatory and inhibitory inputs over different domains of CA1 neurons. (A–C) Total length, absolute and relative amount of excitation and inhibition over seven cell types. Note the large difference in the amount of converging inputs and in the ratio of inhibitory inputs. (D) Ratio of inhibitory inputs over different compartments of the cell types. Note the increase in the ratio of inhibition toward the soma, which, in the extreme case of PCs means that no excitation arrives somatically. (E–F) The distribution of excitatory and inhibitory inputs among compartments for the different cell types. A significant portion of inhibition arrives proximally for most neurons. In the case of PCs virtually all excitation arrives distally. The data presented in the figure is a summary of results from our earlier anatomical results (Gulyás et al., 1999; Megías et al., 2001; Mátyás et al., 2004; Takács et al., 2008).

