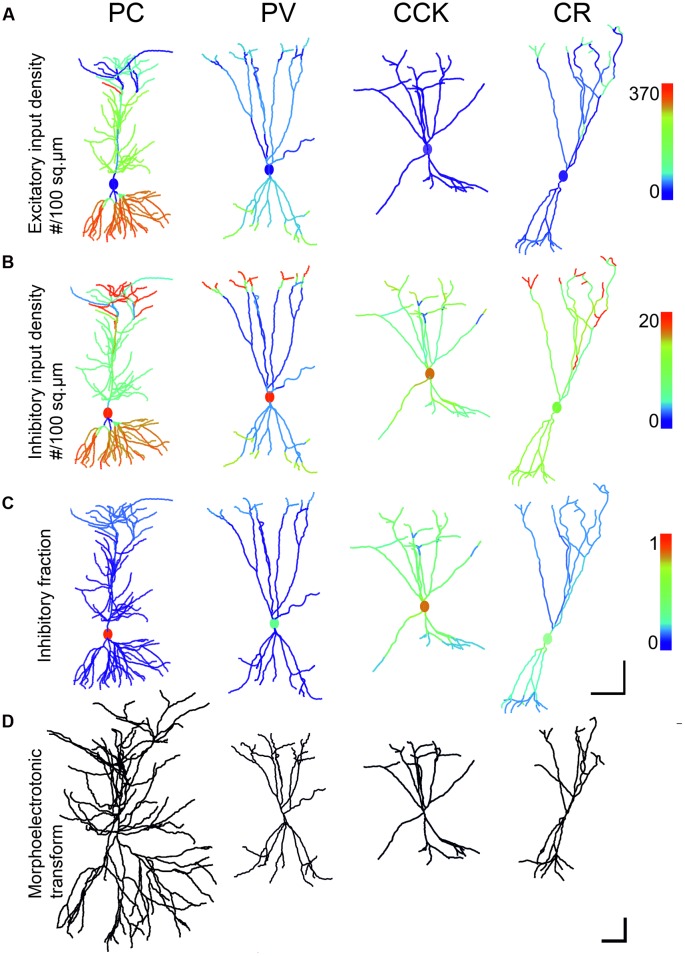
FIGURE 3.
Comparison of input density, excitatory to inhibitory ratio and morphoelectrotonic length of modeled neurons. (A,B) The first and second rows show the excitatory and inhibitory input densities per membrane surface for the four examined cell types, presented on the same color scale for the same type of inputs. These values were used in the simulation when calculating convergent synaptic inputs in different states. Note that the PC receives the densest excitatory input onto its second order dendrites. (C) The third row shows the ratio of inhibitory inputs over the compartments. Inhibition is centered on the soma for all neurons. PC perisomatic regions get almost exclusively inhibition. CCK cells receive the highest amount of inhibitory input. (D) The fourth row shows the morphology of neurons after morpho-electrotonic transformation taking into consideration dendritic diameters. PCs are the least compact due to the small diameter of the second order oblique basal and apical dendrites that constitute the majority of dendritic compartments. Interneurons are more compact, due mainly to thicker higher-order dendrites. Scale: (A–C) 100 μm; (D) 1 lambda (electrotonic length constant).

