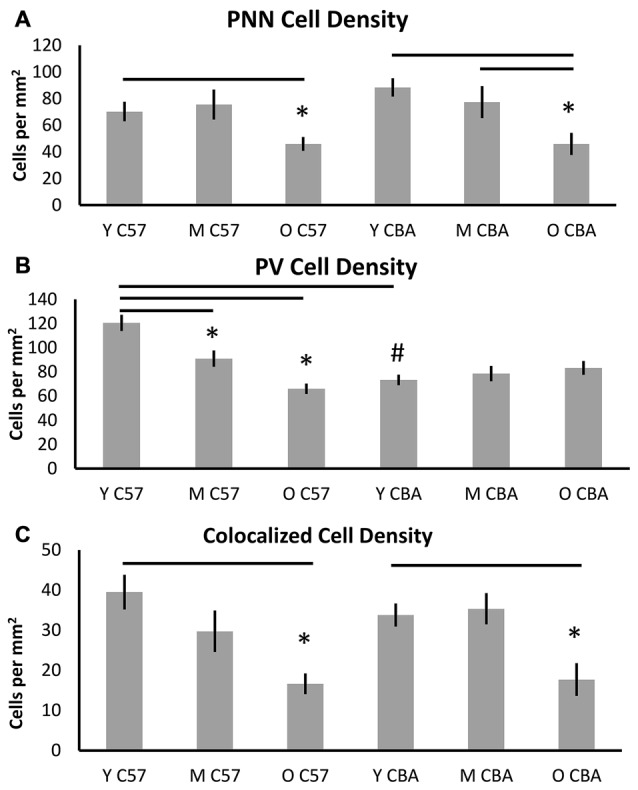
Figure 3.

Density (cells per mm2) of (A) PNN+, (B) PV+, and (C) PV/PNN co-localized cells in A1 (all six layers combined) are shown. Asterisks indicate a significant difference from the Y group within the same strain. The “#” indicates a significant difference between age-matched groups across strains (p < 0.05).
