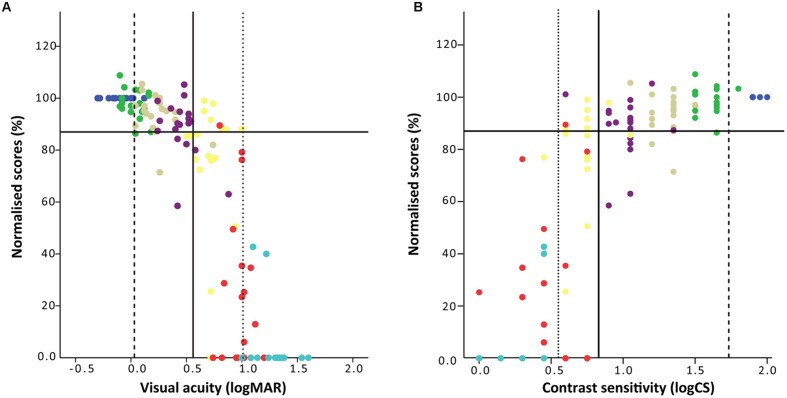
FIGURE 1.
Shooting performance as a function of (A) VA and (B) CS. The x-axes show the level of visual function achieved by each of the 19 participants in each of the seven levels of simulated VI (habitual vision – violet, filter level 1 – indigo, 2 – blue, 3 – green, 4 – yellow, 5 – orange, and 6 – red), with lower logMAR values representing better VA, and higher logCS values representing better CS. The y-axis shows the shooting performance as a percentage of the habitual baseline performance. The solid horizontal lines in (A,B) indicate the cut off point below which shooting performance is considered to be significantly worse than baseline (determined by the lower bound of the 99% confidence interval at baseline, in this case 87% of the baseline score). The solid vertical line represents the Youden’s J, the dashed vertical line maximum sensitivity and the dotted vertical line maximum specificity.

