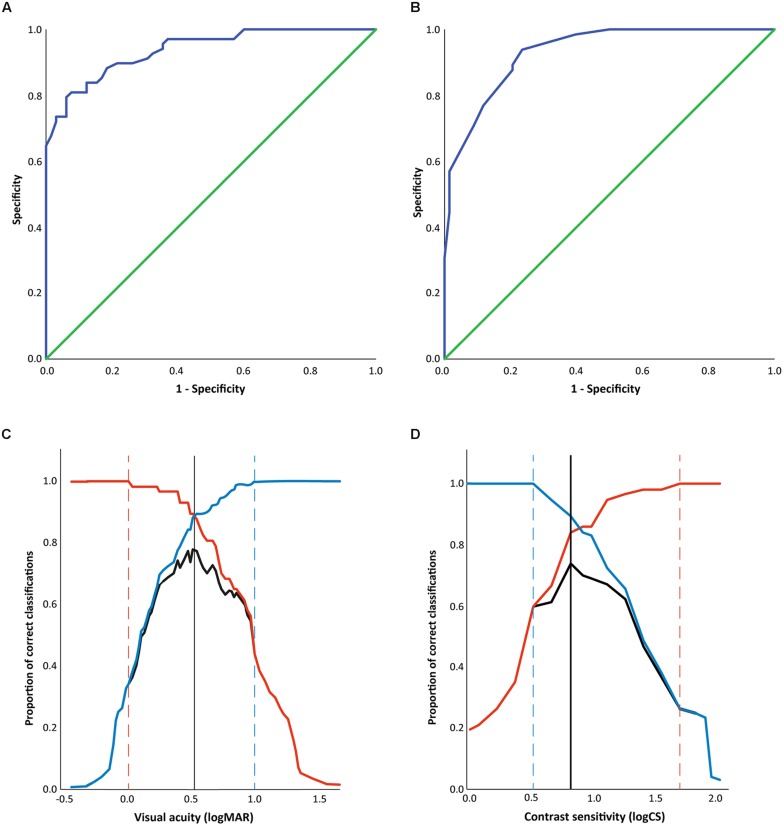
FIGURE 2.
(A,B) Receiver Operating Characteristic curves showing the sensitivity and specificity of (A) distance VA cut-off and (B) CS cut-off in correctly classifying athletes as achieving ‘expected’ or ‘below-expected’ performance. The diagonal green reference line represents an AUC of 0.5, indicating that a test would have no discriminative ability to classify athletes. Perfect discrimination of athletes’ performance by visual function (AUC = 1.0) would be achieved with a line following the top left hand corner of the graph. The blue line indicates the performance of the visual functions, with both distance VA (A) and CS (B) having an AUC of 0.94 ± 0.02 (p < 0.01 to reject the null hypothesis that the AUC is 0.5 in both cases). (C,D) Sensitivity (red), specificity (blue) and Youden’s J (black) for cut offs of different levels of (A) VA, and (B) CS. Sensitivity indicates the proportion (0–1) of those with below expected shooting scores who have visual function poorer than the cut-off, and the dashed red line indicates the cut off providing maximum sensitivity. Specificity indicates the proportion (0–1) of those with expected shooting scores who have visual function better than the cut-off value, and the dashed blue line indicates the cut off providing maximum specificity. Youden’s J indicates the proportion of the entire sample correctly classified by the cut off, with the maximum value indicated by the black line.

