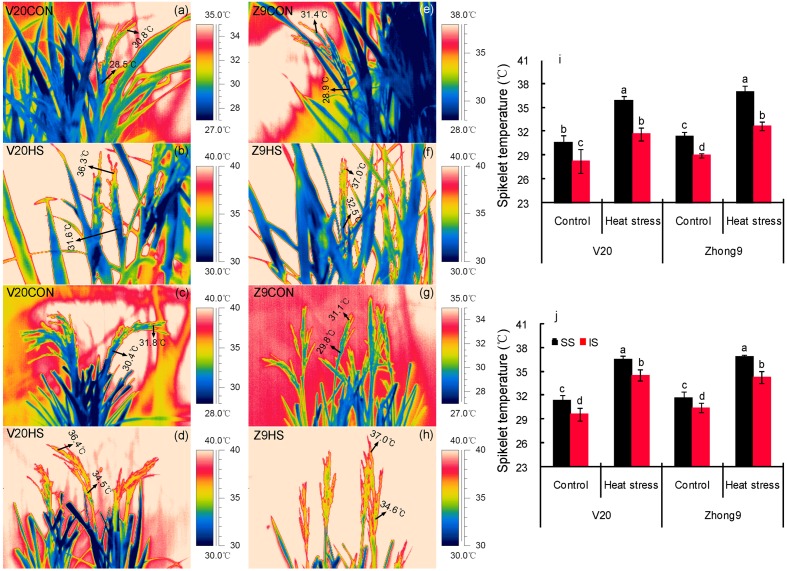
FIGURE 4.
Thermal images of superior and inferior spikelets with (a–d,i) or without (e–h,j) leaves. These thermal images were photographed on day 4 after heat stress of 40°C at 10:00 am–11:00 am, avoiding exposing direct sunlight. V20CON and Zhong9CON present genotypes V20 and Zhong9 under control condition, while V20HS and Zhong9HS present V20 and Zhong9 under heat stress. SS and IS were indicated as superior spikelets and inferior spikelets, respectively. The data in the figures (i,j) were shown as the mean of 10 replicates. Vertical bars denote standard deviations (n = 10). Different letters indicate significant differences between the superior spikelets and inferior spikelets in the same cultivar (P < 0.05).

