
Table 1.
Participants' use of tobacco and marijuana products (N=32)
| Product | Ever use (%) | Past 30 days (%) | Daily user (%) | Days used in past 30, median (IQR) | |
|---|---|---|---|---|---|
| Tobacco cigarettes |  |
90.6 | 43.8 | 15.6 | 0 (0–10) |
| Little cigars or cigarillos | 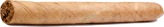 |
78.1 | 43.8 | 9.4 | 0.5 (0–9.3) |
| Electronic cigarettes | 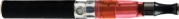 |
78.1 | 46.9 | 9.4 | 0.5 (0–10) |
| Hookah |  |
81.3 | 34.4 | 3.1 | 0 (0–1) |
| Moist snuff |  |
25.0 | 0 | 0 | 0 (0–0) |
| Snus | 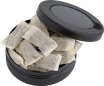 |
18.8 | 0 | 0 | 0 (0–0) |
| Smoked marijuana | 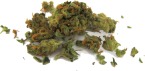 |
96.9 | 93.8 | 43.8 | 28 (15–30) |
| Marijuana vaporisers |  |
90.6 | 81.3 | 6.3 | 2 (1–10) |
| Marijuana edibles |  |
93.8 | 68.8 | 3.1 | 1 (0–3.8) |