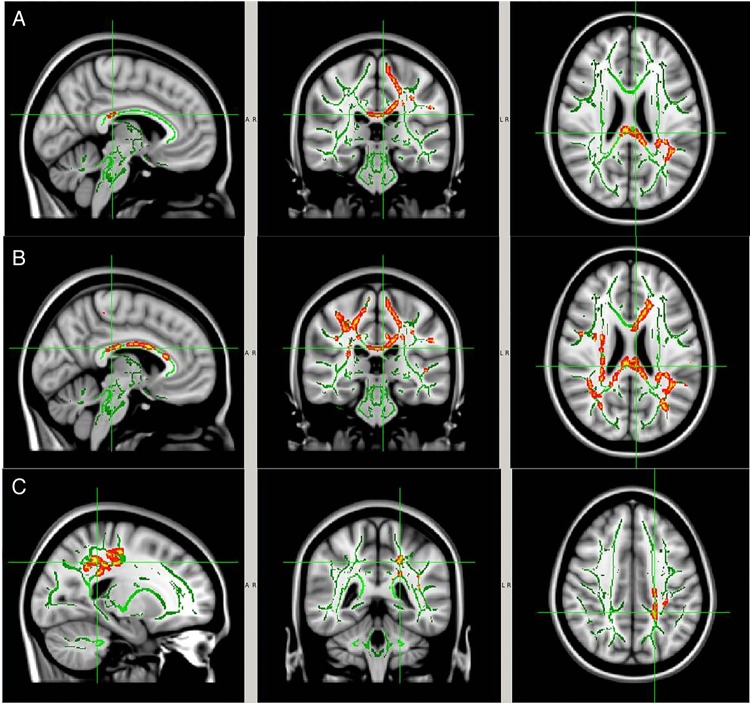
Figure 9.
WM areas with significant between-group differences (CTRL vs collar), preseason versus postseason. (A) MD; (B) AD; and (C) RD. The significant regions (red-yellow regions, p<0.05, FWE corrected for multiple comparisons) were overlaid on to the WM skeleton (green) and standard T1-weighted image in MNI 152 space (grey scale). The significant regions were filled in using tbss_fill in FSL to improve visualisation. Image orientation is in radiological convention. AD, axial diffusivity; FSL, FMRIB Software Library; FWE, family-wise error rate; MNI, Montreal Neurological Institute; MD, mean diffusivity; RD, radial diffusivity; WM, white matter.

