
Figure 2.
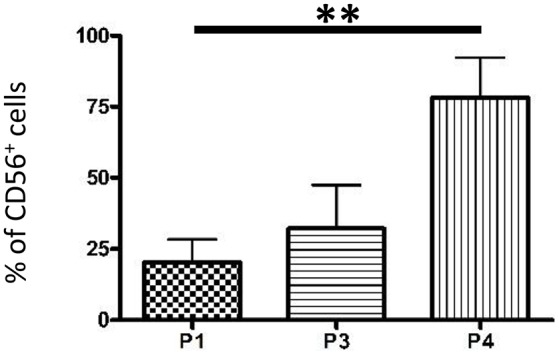
Quantification of CD56+ DP-MSCs upon in vitro amplification. Proportion of cells expressing CD56 in the whole DP-MSC population in vitro at the end of passages 1 (P1), 3 (P3), and 4 (P4). Error bars: mean ± SD. n = 5. ** P < 0.01.
Official websites use .gov
A
.gov website belongs to an official
government organization in the United States.
Secure .gov websites use HTTPS
A lock (
) or https:// means you've safely
connected to the .gov website. Share sensitive
information only on official, secure websites.
Quantification of CD56+ DP-MSCs upon in vitro amplification. Proportion of cells expressing CD56 in the whole DP-MSC population in vitro at the end of passages 1 (P1), 3 (P3), and 4 (P4). Error bars: mean ± SD. n = 5. ** P < 0.01.