FIGURE 2.

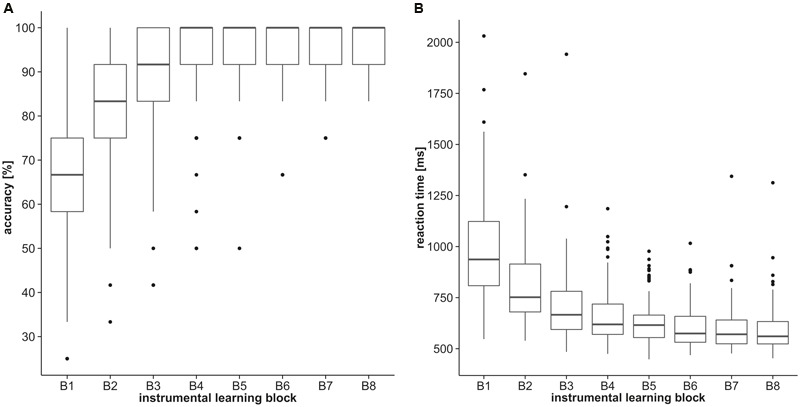
Discrimination training performance. Boxplots represent (A) accuracy (percentages of correct responses) and (B) reaction times of the eight discrimination training blocks.

Discrimination training performance. Boxplots represent (A) accuracy (percentages of correct responses) and (B) reaction times of the eight discrimination training blocks.