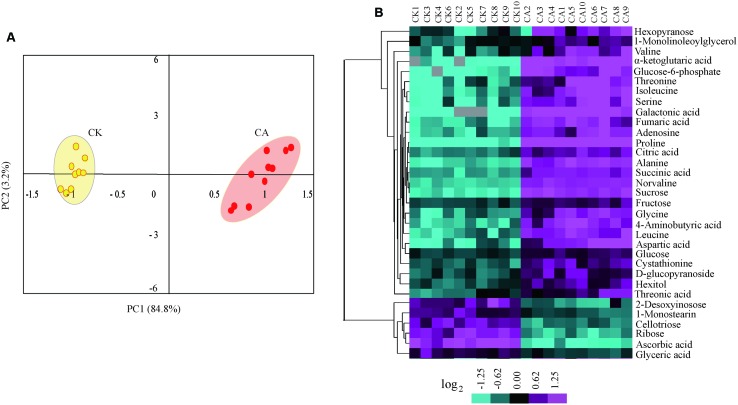
FIGURE 3.
Metabolome reprogramming during cold acclimation (CA) in comparison with control. Shown are the metabolome profiles for ten independent biological replicates of CA and parallel control replicates (CK). (A) Principal component analysis (PCA) depicted a metabolome reprogramming during CA as compared with control. Values for x and y axes are scores for PC1 and PC2. (B) Hierarchical cluster analysis (HCA) of all differentially accumulated metabolites between CA and control treatments. The bar at bottom represents the color code for log2-transformed data of metabolite accumulation using the CLUSTER software package. The levels of metabolite accumulation are listed in Supplementary Table S1 in Supplementary Material.

