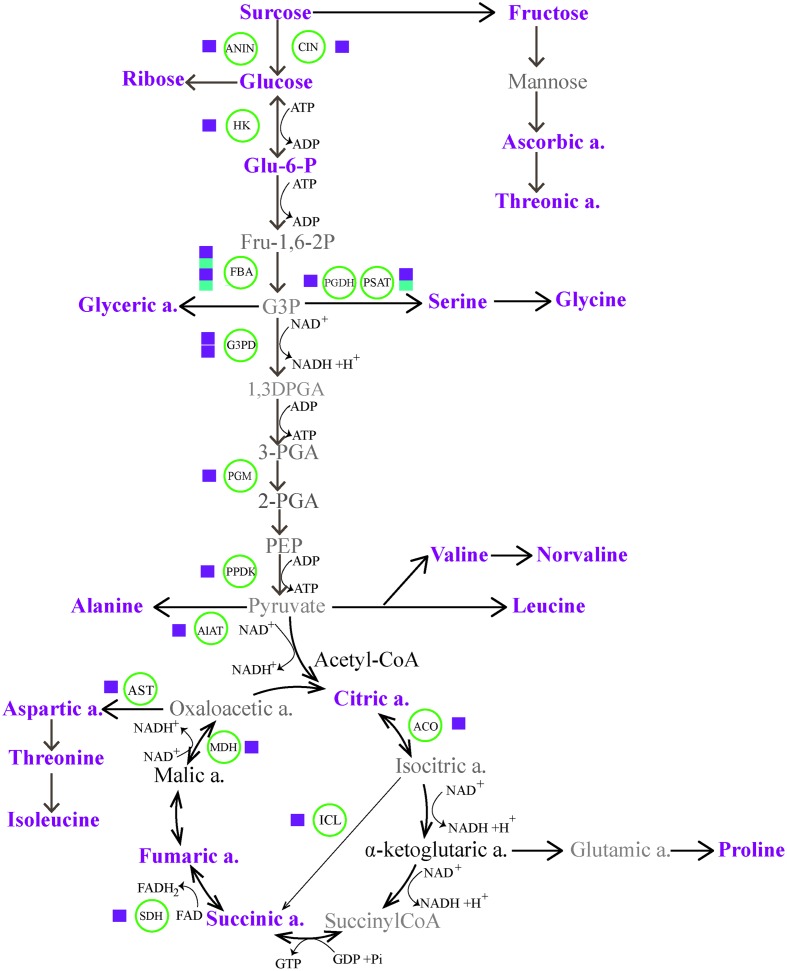
FIGURE 5.
The energy homeostasis strategies through carbohydrate and amino acid metabolic pathways, indicating massive transcriptome and metabolome reprogramming during cold acclimation (CA). The magenta and cyan squares represent up-regulation and down-regulation of a biosynthetic gene. The metabolites in magenta represent up-regulated accumulation under CA compared with control. The metabolites in bold show no differences in accumulation, and the metabolites in gray are not identified by GC-MS. ACO, aconitate hydratase; AlAT, alanine aminotransferase; ANIN, alkaline and neutral invertase; AST, aspartate aminotransferase; CIN, cell wall invertase; FBA, fructose-bisphosphate aldolase; Glu-6-P, glucose-6-phosphate; G3DP, glyceraldehyde 3-phosphate dehydrogenase; G3P, glyceraldehyde-3-phosphate; HK, hexokinase; ICL, isocitrate lyase; MDH, malate dehydrogenase; PEP, phosphoenol pyruvate; 3-PGA, 3-phosphoglycerate; PGDH, D-3-phosphoglycerate dehydrogenase; PGM, phosphoglycerate mutase; PPDK, pyruvate phosphate dikinase; PSAT, phosphoserine aminotransferase; SDH, succinate dehydrogenase.

