Fig. 2.

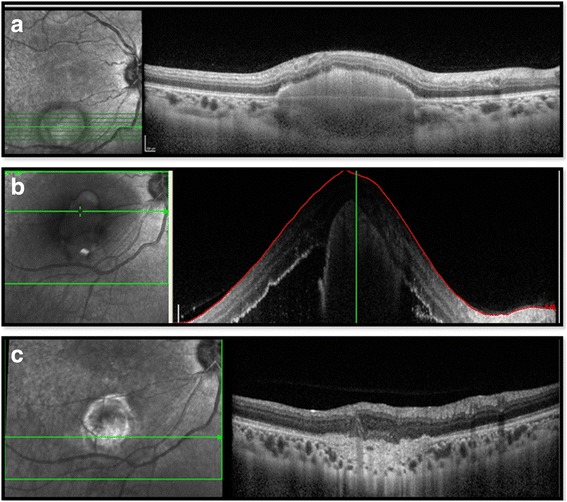
Comparative optical coherence tomography scans passing through the granuloma at presentation (a), after starting ATT and ART with massive fluid collection (b), and fluid resolution after anti-VEGF therapy (c)

Comparative optical coherence tomography scans passing through the granuloma at presentation (a), after starting ATT and ART with massive fluid collection (b), and fluid resolution after anti-VEGF therapy (c)