
. 2016 Nov 8;5(1):1930. doi: 10.1186/s40064-016-3603-5
© The Author(s) 2016
Open AccessThis article is distributed under the terms of the Creative Commons Attribution 4.0 International License (http://creativecommons.org/licenses/by/4.0/), which permits unrestricted use, distribution, and reproduction in any medium, provided you give appropriate credit to the original author(s) and the source, provide a link to the Creative Commons license, and indicate if changes were made.
Fig. 4.
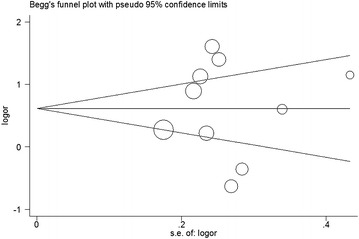
Begg’s funnel plot of the T versus C genetic model